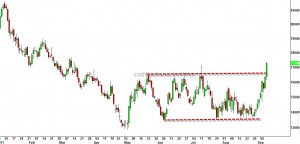
Oct 172011
 

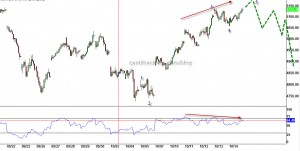
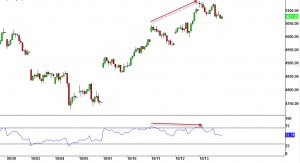
Nifty(5132): The short-term divergences in the charts are getting more pronounced. This is analogous to an auto mobile continuing on its path without fuel but on residual motion.

Nifty -intraday chart

I can also count a small degree wave 5 that is nearing completion. Volume footprint tells us that the area of 5090 and 5070 is very crucial and might act as the bull-bear divide in the short-term. Since the previous day's low is just slightly below this level at 5056 that must the stop for those who are long on the market.

Remember, the larger trend is still down as long as the market is still below 5330. With Nifty already near 5200, and significant overhead resistances ahead, the probability that this market will head much higher looks very low. At the same time, a significant decline also seems like a low probability before October 25th . Hence, we will pull a nuetral strategy on the market with the outer-perimeter in mind.

Nuetral Strategy- Bear Strangle:

Write n contract(s) Nov 24th 2011 5200 call at or near 45 and Simultaneously write n contract(s) Nov 24th 2011 4700 put at or near 136.

Margin Required: Aprrox Rs 32000/strangle

Credit Recieved: Aprrox Rs 177

As long as Nifty remains between 4523 and 5377 the strategy will make money.

At October expiry the strategy is likely to yield a profit of Rs 30/strangle - roughly 10% on the margin paid.
 Posted by at 2:45 am
Oct 162011
 

Inter-market analysis provides an extra dimension to technical analysis - the peripheral vision and the backdrop in which we are operating. Here is one such inter-market factor. To me this is pretty much like looking at the charts of the Baltic Dry Index.

Over the last few weeks if you have been left wondering if the markets around the world have turned a corner, you might want to have look at the following pictures.

Vessels backlog 1

Vessels backlog - view from my Condo

Cargo backlog 2

Please click on these pictures and have a larger view. As you might understand from the caption, these are cargo vessels that have been standing idle for months together here in Singapore and some might be more than a year. The number of vessels over the last few months have only increased albeit at an alarming pace. Talk to anyone in the shipping business they would tell you what these pictures are telling. I personally know someone who owned a ship and went bankrupt - their next generation is still trying to pay off the debts and in all likely-hood, that person is unlikely to pay off the debt until their retirement age. The same would be true of corporations. In short, this is not a cheerful sign.

Singapore backlog - a small video clipping of the ECP coast (singapore).

 Posted by at 3:03 pm
Oct 142011
 

Nifty(5077): Nifty opened near the high of the day but ended right near lows of the day. Was that the end of the corrective rise? Possibly. The next couple of sessions are going throw some vital clues. The intraday chart for Nifty is shown below:

Nifty - intraday chart

We can see very clear divergence between the price at the top and momentum shown at the bottom pane. Normally, these are precursor to a change in trend. In opening trades, if we see Nifty rise but struggle under 5127 (spot) or even 5105, this might be another sign that the corrective rise from 4728 to 5136 may have run its course. We will see if we can pull a short-term trade in that case.

Volume footprint : 5040-5010 zone needs to be taken out for bearish play.

 Posted by at 2:47 am
Oct 132011
 

The bearish signals that came through on Wednesday were rendered void yesterday by the strong up-move yesterday. This is exactly why we never pre-empt the market. It has always paid well to wait for the breach for the previous days low (or the previous days high in a bullish case). If you did notice, Wipro was relatively weak in yesterday's strong price action for the IT stocks.

The focus now shifts to the critical 5170 on the Nifty. As long the market stays below that level, the next leg being a sharp to the downside remains.  Watch out for the USDINR cross rates. The level of 48.3 is an important and a reversal around that could mark an important turning point.

Whenever I have doubts whether we are in a bull market or bear market, I always revert to my prop indicator of the indian economy. It still says we have not reversed and quite a distance from it. (See Nov post on the reliability of this indicator)

India barometer

We still see short-term positives in HUL, Bharti and Syndicate - if market provides the right environment we will try position ourselves long here for some quick gains.

 Posted by at 2:42 am
Oct 122011
 

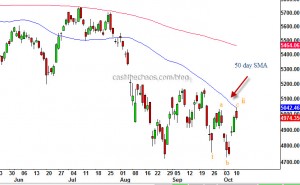
Nifty(4974.35): Yesterday's price action on the Nifty was a mildly bearish set up. The index got repelled from it's 50 day SMA and closed near the lower third of the range.

Nifty - Daily Chart

So what I had projected on Oct 3rd is still a possible count as long the Nifty stays below 5170. The volume footprint tells us that if Nifty drops below 4950-40 zone the likelihood of Nifty dropping to 4855 is a strong possibility. Given that we have Infosys results today, be ready for a quick drop if Nifty breaches this level.

Talking about Infosys, the CNX IT Index saw a much more significant bearish price action.

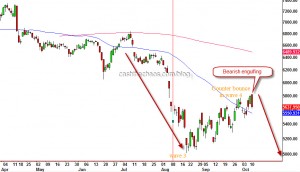
CNX IT - Daily Charts

The pattern formed on the daily charts was a bearish engulfing candle at the end of potential wave 4 end and the beginning of a wave 5. You would I recall from my CNBC interviews that I'm expecting CNX IT to drop to about 4800.

So how do I convert these to actionable strategy:

Nifty: If Nifty drops below 4940, I would sell with stop above the first hour highs or a 35 point stop whichever is further for a 1-3 day price objective of 4855. If it drops right below this level out of the gate - I would buy Minifty 4600 Oct puts between 25-28 with a stop of 15 for a price objective of 70-75. Do Nothing unless Nifty breaks 4940.

CNX IT: The weakest amongst the IT stocks to me is Wipro. I would sell Wipro short and use 363 as stop at a daily closing level and look for 280 in the next 6-8 weeks and 320-15 as price objectives for the short-term (1-4 weeks). Again do nothing unless yesterday low is broken.

PS: All levels correspond to cash/spot price unless stated otherwise.

 Posted by at 3:00 am
Oct 032011
 

Just a quick chart check.

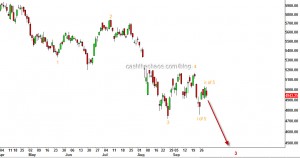
Nifty - Daily chart

If the sub-divisions marked are correct, we should see 4750-20 get breached soon, may be as early as this week. For medium to long-term please check the September and August post.

Sep 162011
 

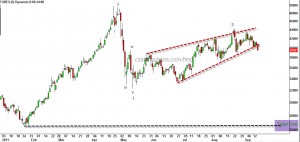
Silver saw a steep drop from $50 to $32 in the month of May and the rise post that has been in a corrective fashion.

Silver - rising wedge

The above chart of silver shows a rising wedge pattern with a typical throw-over to the upside. Yesterday's close was well below the bottom of the rising wedge and this should usher in a sharp down move for the industrial metal probably before the end of this month. Looking at the chart from an Elliott wave perspective, silver is probably in its powerful 3rd wave or C wave which has the characteristics of wave 3. At $26.7 the first leg of the decline from 50 would be equal to the move from 44.27 (and hence A=C), the August peak, which seems like the minimum drop that is likely for silver. Also the $26 zone is the previous 4th for Silver.

Naturally, some of us would be thinking, "what happens to gold now?"

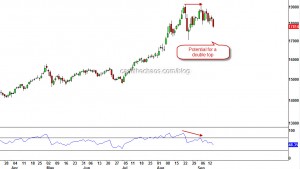
Gold Daily Chart - Potential for a double top

Here too, it is obvious that Gold is running into troubled waters. A fake print above 1913 high, momentum disagreeing with the new high in price are all tell-tale signs of exhaustion. A close below 1763 or an intraday drop below 1705 would complete a double top for gold and should draw prices at the very least to 1480.

Given the fact that the Dollar Index too had a breakout to the upside just a few days ago,  you might want to pay considerable attention to these signals in the precious metals space.

Sep 122011
 

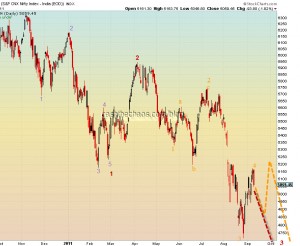
Some of you have requested my short term view on Nifty and here goes.

Nifty Daily Charts

The upward correction that started from 4720 saw some serious selling pressure on Friday. It is possible that this correction may have ended as per the red scenario and a new low may be coming. Alternately, the upward correction may have a little more juice before another new low for the year comes through(orange scenario). So if anyone decides to go short, they need to do be ready with money management strategy around the 4900 zone of Nifty.

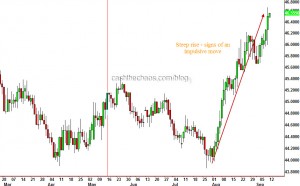
While we are here let us also look at the INR charts.

INR daily charts

The pace and steepness of the USD's appreciation against the rupee has all the signs of an impulsive move. You might want to go back and refer to our Aug 26th post on the INR for the bigger picture.

As some of you would have noticed from the comments section, I consider the breakout in the dollar index a significant contributor to the global bear case.

Dollar Index - Daily Charts

After building a base for 3 months, the dollar index has broken out of a range. This is likely to accentuate the risk aversion across various asset classes.

Given the strength in the dollar index and weakness in rupee - I will not be surprised if a new low comes through in the month of September for equity markets.

PS: Ill be on Bloomberg-UTV today at 8:30 IST.