Sep 012010
 

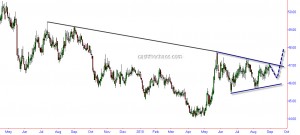
As mentioned in my August 27th post, the Indian Rupee has hit the upper borders of the trendline and looking at today's SGX Nifty at pre-open and early currency market moves, it may be moving along expected path. This is shown in the chart below:

USDINR Daily Chart

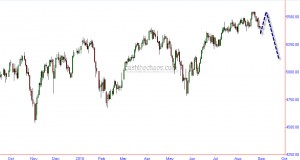
So if USDINR charts this path, the stock markets should take an inverse path - that either stalls under highs of August or makes a high slightly above 5600 and pulls lower sharply when INR breaks out of the symmetrical triangle. The chart below shows this scenario on Nifty.

Nifty Daily Charts

Is the Auto sector topping out?

 Uncategorized  Comments Off on Is the Auto sector topping out?
Aug 302010
 

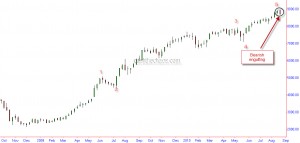
I did mention in my friday's update that a close below 5452 would be a bearish signal for the Indian market. Besides an engulfing bearish candle pattern on the Nifty,  one other key index in this bull run,  the auto index has also formed a bearish engulfing candle on its price chart.

BSE Auto Index - weekly chart

In March 09 when the broad markets were trying to form a bottom, this sector was already on its first leg of the rally. As can be seen from the chart above, besides the candle pattern, the advance looks like a completed 5 wave advance indicating a possible exhaustion.

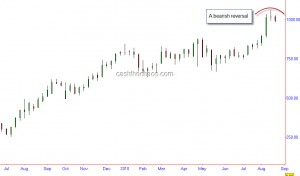
Looking at the chart of Tata Motors gives a similar picture. Further negatives likely for Tata Motors if the stock starts trading below the previous week's low of 983.

Tata Motors - weekly chart

 Posted by at 2:25 am

Channel lines puts pressure on Nifty

 Uncategorized  Comments Off on Channel lines puts pressure on Nifty
Aug 272010
 

First post from Singapore - settling down here took a bit longer than anticipated. OK, back to markets 🙂

As can be seen from the chart below, the channel lines are putting pressure on the Nifty.
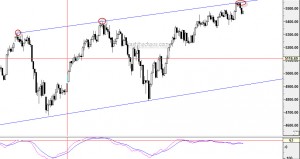
Nifty Daily Chart

Also, momentum peaks continues to disagree with the new price highs.

In my March 8th post, I had projected that Nifty should reach a minimum target in the region of 5600 but we dropped that stance in April expecting a correlated breakdown along with US markets. After initially declining to 4800 on the Nifty, Indian markets showed great resilience and outperformed almost every market in the world. So what has this got to do in the current context? The current high of Nifty satisfies the minimum level required for wave 5 completion (approx equals wave 1). Also, if Nifty closes below 5452 today (farther from this the stronger the signal ), a moderately negative to highly negative candle will be formed on the weekly charts.

Looking at the USDINR crosses, a symmetrical triangle seems to be in play and the upper borders of this triangle shares a common boundary with a medium term trendline.  A convincing move above this level will mean more weakness for the Indian currency and as a corollary further weakness for the stock markets.
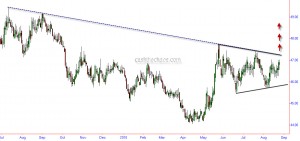
USDINR Daily Chart

My guess is that the Rupee will hit the upper borders today and pull back into somewhere into middle of the triangle to lower borders of the triangle, gather steam and then push past the 47.15 breakout level. If this scenario pans out - there might another push towards the high for the Nifty after the current decline. Let us see how the market pans out.

We were more focussed about going to cash and buying OTM puts as protection rather than going short between April and July. Considering that September is historically one of the weakest months, we will consider being short in a small way and try to build on them if situation warrants.
Jul 152010
 

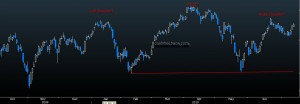
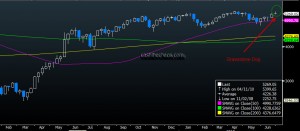
Here is a chart of Indian Nifty in Dollar adjusted value.

Nifty daily chart - Dollar adjusted value

As is obvious from the above chart, Nifty has not even crossed the June highs, leave alone the April highs. And this could be the completion of a right shoulder in a head and shoulder top. While Nifty could very well continue to push higher and cross the highs of April in dollar terms- but other technical evidences at the moment do not favour that scenario. I guess by the time I post my next update from Singapore, markets should  have more evidence of which way they are headed.

Good trading to all!

Jul 112010
 

Hi everyone, I've been erratic with my posts and that will continue to be the case all through July. I'm relocating out of UK and my time and energy is focused on the relocation. Hopefully, by 1st of August Ill be all set in Singapore and updates on this blog should get regular.

Will keep updates coming as and when time permits until then.

Good trading to you all.

 Posted by at 10:44 pm
Jul 052010
 

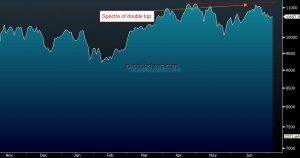
For the first time since 2009 cracks have started to appear amongst India's banking stocks. ICICI bank is showing considerable weakness and a close below 815 may weigh heavily on the banking index. HDFC bank is showing potential for a double top - of course this is not fatalistic but a close above 2025 will neutralise the negatives. A prudent investor/trader must watch the Bankex Index for clues to how the Indian markets are going to resolve.

BSE Bankex Line chart - Source Bloomberg

A close below 10100 for the Bankex would be a warning sign for further weakness in Banks and as a consequence for the broader indices - Nifty and Sensex.

Jun 302010
 

The Grand Daddy of technical analysis, the Dow Theory,  indicated that the US markets have slipped into a primary down trend - in other words known as a bear market. The Dow Industrials closed below its May trough of 9810, a day after the Dow Transportation Index closed below its May trough of 4034. I'm not even going to bother with the charts as I'm sure the internet is filled with this news.

In this process, US markets have also completed the H&S pattern we highlighted in our June 15th post https://www.cashthechaos.com/blog/?p=261

In the extreme short-term, US markets could be in for a bounce as the Nasdaq has had 8 consecutive down days and the Dow and S&P 7 down days in 8. While such a bounce is not a guarantee, if it occurs, it would be an opportunity to get short and get out of longs positions if any.

Indian markets which have shown tremendous resilience and outperformed world markets so far, may not do so for long.  Expect more intense selling pressure next time Nifty trades below 5259.

Bonds breaking out

 Uncategorized  Comments Off on Bonds breaking out
Jun 292010
 

The chart below is that of  US bond ETF.  The breakout here is quite obvious and significant.

20+ year Treasury Bond fund - Source Bloomberg

Looking at India's 5yr interest rate swaps - a downward trend seems to have been established.

5year Interest rate swaps - Source Bloomberg

The message is quite straight forward:  investors are seeking the safety of bonds and hence another wave of selling in the equity markets is likely.

 Posted by at 6:49 pm  Tagged with:
Jun 282010
 

As can seen from the chart below, a gravestone Doji formation is visible on Nifty's weekly chart.

Nifty weekly chart - Source Bloomberg

This pattern is moderately bearish and a follow up selling this week(Friday's close) that takes Nifty below the low of 5259 would draw in more sellers.  Aggressive strategy would be to sell below the low of last week while a conservative approach would be to wait for this week's close to see if there is a bearish reiteration. A close above the high of 5366 would nullify the bearish signal.

USDINR reclaims 200 DMA

 Uncategorized  Comments Off on USDINR reclaims 200 DMA
Jun 252010
 

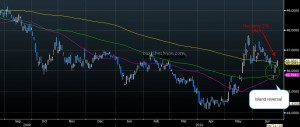
After a bout of choppy trading in the last 2 weeks, the USDINR pair closed above its 200 DMA.  The point to take note here is that the pair crossed  this level after registering a island reversal and is a pointer to further strength for the dollar against the rupee in the coming days.

USDINR Daily Chart - Source Bloomberg