Nifty is now the second worst performer amongst its Asian peers (taking USD into account) only behind the Philippines Index. In absolute terms, at the third place behind Philippines and China. Although on a quarterly/half yearly and Annually the Indian Indices are scoring handsome gains, what a swift reversal in performance! Anybody there who does not believe in Momentum?
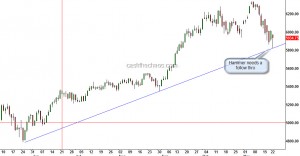
The boundaries of yesterday's low and high marked an important level in many global markets. On Sensex/Nifty yesterday's low is of significance. It was not just a 'hammer' pattern - the low also came of an important trendline.
The trendline is more perfect if drawn on the Sensex, we can connect the lows of March 2009 through these significant lows. A close below yesterday's low can make things turn nasty and that makes yesterday's low a must hold.
Axis Bank – a trend reversal?
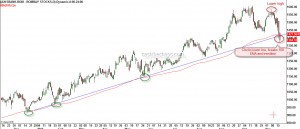
For the first time in since March 09, Axis Bank has clocked a lower high, lower low pattern. This is shown in the chart below.
Also visible on the charts, is the break of an important trendline and 100 day exponential MA. The green circles on the chart highlights how these levels acted as supports during prior declines. A breach of these levels along with a lower low, lower high pattern is a clear warning signal that the risk has grown for those holding longs. Ideally, I will look to enter short positions on a small rise.
A similar breach is visible on BPCL (no trendlines though).
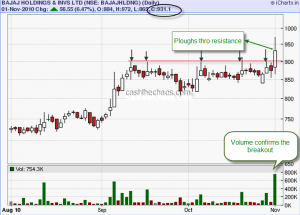
Bajaj Holdings breaks out
Watch out for Central Bank
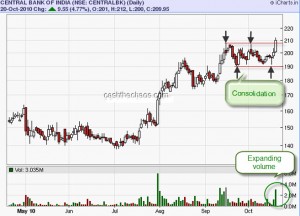
When a stock breaks out of a range, it often provides one of the best trading opportunity. When that happens on a day when the broad indices are falling, the stock deserves even more attention. The price action of Central Bank highlights this scenario. After a smart consolidation between 209 and 190, the stock has broken out of this range with expanding volumes on a day when Nifty ended 0.75% in the red. This stock is likely to be a mover in the next few days and may be over the next couple of weeks.
Many a times I have noted, big names, big firms botch Technical Analysis in their basics. When it happens, I usually mutter a few words to myself and just let them pass. But this time around, I've not been able let it pass.
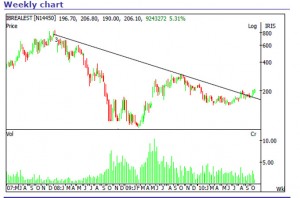
Here is a chart from the technical analysis desk of a leading firm that has concluded that this is a trendline breakout:
If you notice the peak of the "trendline" starts from a point of comfort not the actual peak. And the middle of trendline is the only point where this "trendline" meets a peak of a swing of this "descending trendline". And there is no third point at all!!!!! Basic maths tells us that if you connect 2 points you can draw a line. In the past, I've seen many lines being called a trendline but this time around with just one point!!! Now, that is really a first for me!! 🙂 🙂
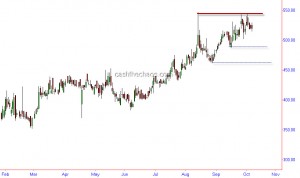
Sun TV risks a double top
The daily chart of Sun TV (above) shows the possibility of a double top formation. However, it does not mean the stock will not cross 547-550 resistance, but the odds are against it. The double top potential would be realised only below 461. Once the stock starts trading below first support of 489 weakness is likely to set in. Hence, a prudent trader should wait for weakness to set in before attempting to short this stock.
