Correction or trend reversal?
In June, I had posted a note on this indicator and wanted us all to keep an eye on it. However, the indicator averted a double top risk and stayed above the previous trough during the May-June correction. Once again its time to keep an eye here. If this indicator dips below the orange line, it would be first warning sign that the existing uptrend is starting to turn weak. Although the possibility of a trend reversal exits only below the red line. I will post an update on this indicator if the indicator dips below either of these two levels.
However, this time around there are couple of things that are loaded in favour of the bearish camp. One, Reliance is an under performer unlike the previous time. Two, SBI, a key leader in this rally, has also started to show pronounced weakness. Thirdly, there is a pronounced negative divergence on Nifty/Sensex daily charts.
What's favouring the bulls? The longer term momentum has matched with the price peaks and one possible wave count points to another leg up (need not result in a high though).
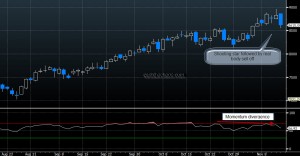
The reddish metal which usually acts as a leading indicator for the equity markets, threw in a late endorsement of the recent down move.
The sell off on Friday reiterated the "shooting star" candlestick signal of the previous trading session. Already, the momentum peaks were not in agreement with the recent swing high. Expect a test of short term support at 8155(LME Copper).
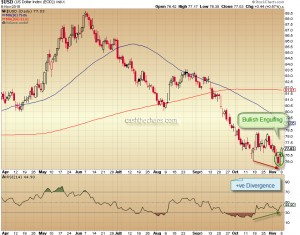
Dollar Index – Either a bottom is around the corner or a bottom is in place
The daily charts of Dollar Index shown above, the drop from October lows to November lows is not matched by a momentum drop. This kind of positive divergence is usually a precursor to a trend change.
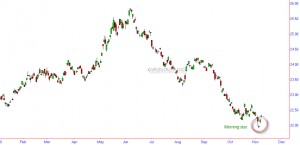
The UUP charts shown above, a morning star candlestick pattern is visible. When this pattern occurs it is usually a strong reversal sign.
Also, I can count 5 wave decline to the November lows and Sentiment readings from Trade-Futures are pointing to a very extreme level of bearishness for the dollar index (hence bullish from a contrarian perspective).
So what does all this mean for the other markets? Commodities and stocks closely tied to commodities are very likely to be the immediate victims. The daily correlation for equity markets with the Dollar Index, though varies now and then, currently stands at a range of -ve 0.83(for S&P)to -ve 0.94(for NSE Nifty) i.e. a very high inverse correlation. It is pertinent to note here that such a high inverse correlation existed for equity markets in November 2009 and when the Dollar Index started a powerful rally in December, a correction in equity markets commenced not until January. So a correction or a trend change in equity markets may either be immediate or may start with a slight lag depending on the strength of the anticipated USD rally. Stay cautious and watch how the markets pan out over the next few days.
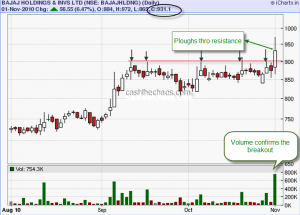
Bajaj Holdings breaks out
Watch out for Central Bank
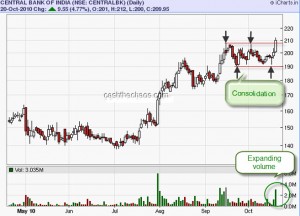
When a stock breaks out of a range, it often provides one of the best trading opportunity. When that happens on a day when the broad indices are falling, the stock deserves even more attention. The price action of Central Bank highlights this scenario. After a smart consolidation between 209 and 190, the stock has broken out of this range with expanding volumes on a day when Nifty ended 0.75% in the red. This stock is likely to be a mover in the next few days and may be over the next couple of weeks.
Many a times I have noted, big names, big firms botch Technical Analysis in their basics. When it happens, I usually mutter a few words to myself and just let them pass. But this time around, I've not been able let it pass.
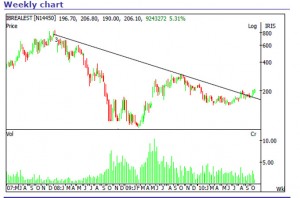
Here is a chart from the technical analysis desk of a leading firm that has concluded that this is a trendline breakout:
If you notice the peak of the "trendline" starts from a point of comfort not the actual peak. And the middle of trendline is the only point where this "trendline" meets a peak of a swing of this "descending trendline". And there is no third point at all!!!!! Basic maths tells us that if you connect 2 points you can draw a line. In the past, I've seen many lines being called a trendline but this time around with just one point!!! Now, that is really a first for me!! 🙂 🙂
Interaction with CNBC TV-18
Sun TV risks a double top
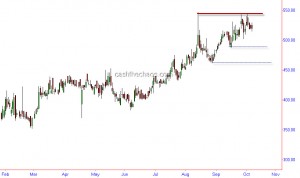
The daily chart of Sun TV (above) shows the possibility of a double top formation. However, it does not mean the stock will not cross 547-550 resistance, but the odds are against it. The double top potential would be realised only below 461. Once the stock starts trading below first support of 489 weakness is likely to set in. Hence, a prudent trader should wait for weakness to set in before attempting to short this stock.
Trade set up on P…
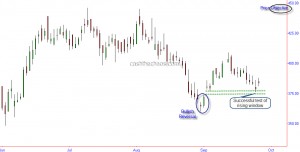
This engineering company has formed a constructive price pattern at its current level of Rs386. After a bullish price reversal at the september lows, this stock formed a rising window pattern. In yesterday's price action the stock successfully tested this support level and the stock got bid up. The larger price structure provides a price objective of Rs440-460 over the next 1-4 weeks. If your risk appetite is low, your stop loss should be below the rising window, else place a stop below Rs360.

