Jai

Mar 082011
 

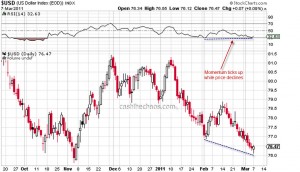
The Dollar index has been on a steady decline since mid-February and is currently one of the least loved asset.  While price has drifted lower, the momentum readings have not matched the price lows.

Dollar Index - Daily Charts

If we went back to the 7th Feb blog post on the Dollar Index (from where there was a small bounce), the Index is trading SLIGTHLY below that medium term trendline. All these line up well for a bear trap. If the currency basket closes above 77.25, I will be brave to venture a long here.

It is also time to have a look at the charts of crude given the amount coverage it has been getting over the last few weeks.

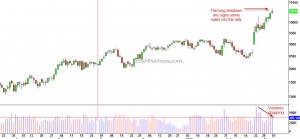
Crude - Daily Charts

While there are no visible signs of exhaustion or reversal here, there are some early warning signs. The volume for these contracts has been dropping over the last few days. If we have a higher close for one or two sessions and then a mild/sharp sell off day, one of my synthetic indicators is likely to flash a sell signal at least for the short-term. The most important signal, I see here is that there is hardly anyone who is NOT BULLISH or does not expect $150-$200 crude. In fact, one famous author of a commodities book, who had been bearish on many commodities including crude is expecting $200 crude now!!!!  Let me warn you here. I'm not trying to say it is time to short crude here. In fact,It is suicidal to out guess the market.  A good trade practice is to be prepared around important pressure points, wait for the reversal and if we have one, evaluate the risk-reward and then pull trigger.
 Posted by at 6:21 am
Feb 282011
 

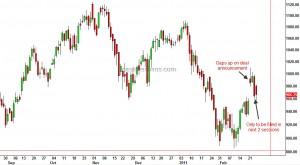
When Reliance announced the deal with BP there was quite a bit of excitement amongst the analyst community. Some even thought this was a game changer for the stock. But here is the stock dipping under the pre-deal announcement levels.

Reliance - Daily Chart

If the stock closes Rs 10 under Friday's close, the deal essentially would mean nothing for the stock! What is quite obvious from the chart is that the gap resulted on February 22nd is nothing but a common gap and has very little potential, if any, to reverse the down-trend of the stock.

Feb 182011
 

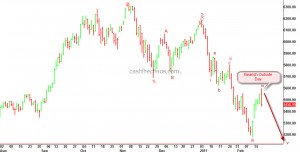
The relief rally for the Nifty that began from the lows of February 11th, ended today with a strong reversal bar. As can be seen from the chart below, today's price action shows a rejection of the early highs and sellers have overpowered the buying pressure of the previous day too. This bearish outside day is marked on the chart.

Nifty - Daily charts

If my Elliott wave labelling is correct, Nifty should decline to a minimum of 5115 in the near term - could be even as quick as 2 weeks or less.

Feb 112011
 

If you have been following my views on business channels, you would know that I have been saying for quite some time now that the decline in stock markets is not just restricted to one or two stock markets in the world. Many markets, frontier and emerging have been taking it in on their chin.

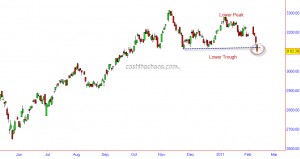
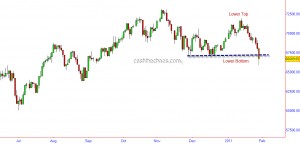
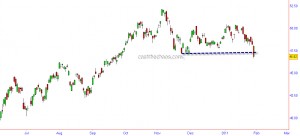
Yesterday, Singapore's STI joined the list of stock indices that have slipped into bear market territory.

The index ploughed through its previous trough and clocked lower top and lower bottom. The Hang Seng Index too is just within a hair's breadth of clocking lower lows and lower highs. A close for the Hang Seng Index below 22620( 88 points below yesterday's close) and this index can also be marked as having entered a bear market. The contagion is spreading.

Raw Sugar – Topped out?

 Commodities  Comments Off on Raw Sugar – Topped out?
Feb 092011
 

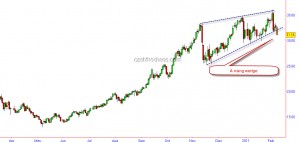
Raw Sugar had been on a tear and the run may have come an end. The chart below shows the commodity breaking out of a rising wedge.

Raw Sugar - Daily Charts

Wedges are ending patterns and have a fairly high degree of reliability. Also from May lows, I can count 5 waves to the February highs and Wave 5 is 1.6 times Wave 1 which is a Fibonacci relationship. If the commodity declines quickly over the next couple sessions, this would be a reiteration of this sell signal. Very interestingly, Raw Sugar has some seasonal cycle working for the last few years around February - top in 2010, 2008, 2006, 2003 secondary top in 2007, 2005 and bottom in 2004 and 2000.

Dollar Index – another bounce on the cards?

 US Markets  Comments Off on Dollar Index – another bounce on the cards?
Feb 072011
 

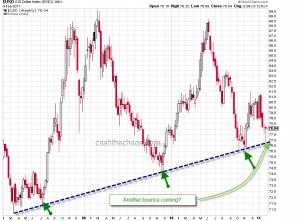
The trendline highlighted on the weekly charts has been a solid support for the Dollar Index despite consistent efforts by the Federal reserve to debase the currency.

Dolla Index - Weekly Charts

An ascent past 78.8-79 would increase the odds of this rally having more legs and clearing the 200 MA( currently placed at 81.61). The much awaited correction for the US markets could be close and those emerging markets stocks which have already been battered (like India) are likely to head even lower.

Bears up the ante

 World Markets  Comments Off on Bears up the ante
Jan 312011
 

Brazilian Bovespa:

Bovespa Daily Charts

The BRIC Index

BRIC Fund - Daily Charts

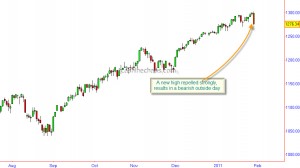
A reversal day in the S&P 500:

S&P500 - Daily Chart

Gold and Nifty

 Uncategorized  Comments Off on Gold and Nifty
Jan 242011
 

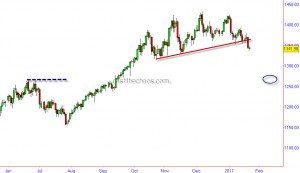
Gold broke through a short-term trendline and has opened up potential for downsides. (If you see our last few posts on Gold, we have been anticipating this decline.)

Gold Daily Charts

If you are a wave fan, you would note that this decline is coming after a 5 wave advance and this decline below 1352 marks the beginning of a strong decline. We are expecting the shiny metal to find initial support around the June highs of 1265.

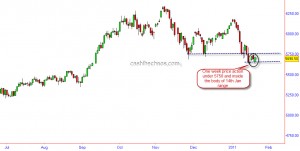
The Indian stock markets though had an advancing week, people have to pay attention to the range of last week.

Nifty Daily Charts

The whole of last week  markets meandered under the range of previous Friday's(the day it breached key support at 5690)  range!!! If this is not bearish consolidation, what is??

Jan 202011


In my interaction with CNBC TV-18 on 19th January, I did highlight that the Indian markets may have slipped into a bear market. Strangely(!) it did not find any recap in their website !

Regular readers of this blog would recall that I had highlighted  in my November post itself (now Password unlocked) that the Indian markets had peaked and a bearish phase was a distinct possibility.

Keep these stock on your watchlist

 Indian Market/Stocks  Comments Off on Keep these stock on your watchlist
Jan 132011
 

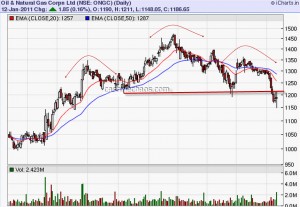
The first one is the heavy weight ONGC

ONGC Daily Charts

IMO, this is not a perfect H&S top, as the volumes have not been supportive of the dip below the neckline. Nevertheless,  due to its high weightage in Nifty and fact that the stock is clocking lower highs and lower lows, it deserves our close attention.

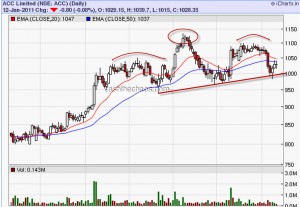
Next is the cement major, ACC.

ACC Daily Charts

A close below the 1000 level with expanding volumes would give the bears the upper hand in this sector.

The third one is the real estate major DLF.

DLF Daily Charts

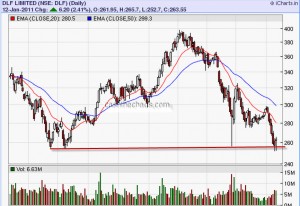
The stock is hanging by a fingernail above its major support of 255. Although DLF did dip below that level on an intraday basis, it managed to close above that level and averted a major disaster here.

If any of these stocks close below the levels marked here, the bears will have more ammunition to launch their assault on the broader market.